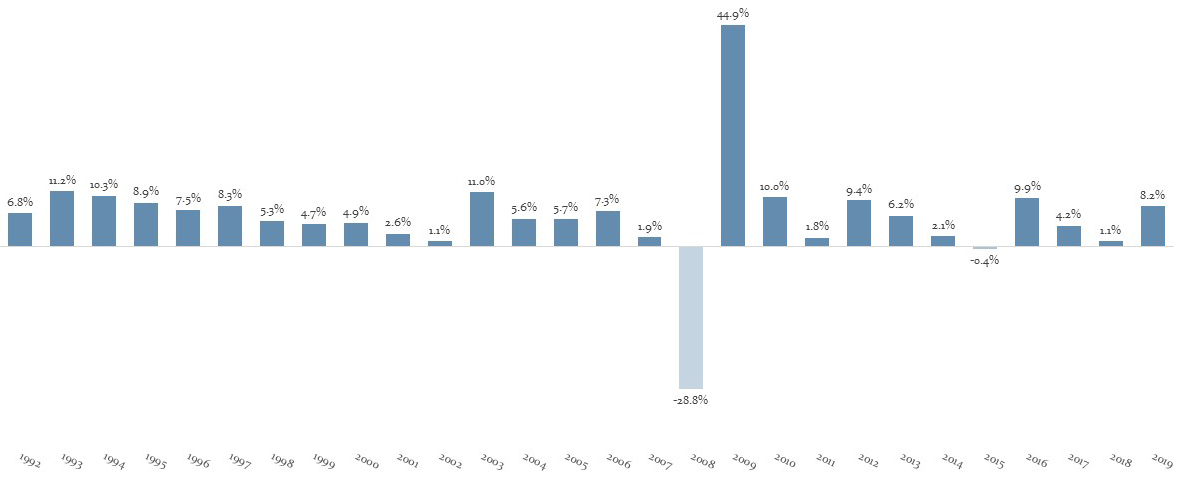
Leveraged loans are generally secured loans made to corporate borrowers often in connection with buyouts, acquisitions, or recapitalizations of existing corporate entities. First lien senior secured leveraged loans are generally the primary collateral held within CLOs. Leveraged loans benefit from the following characteristics:

The corporate capital structure highlighted above is a hypothetical structure and for illustrative purposes only. Corporate capital structures may vary substantially from the hypothetical example set forth above.

Source:Credit Suisse. Past performance is not indicative of, or a guarantee of, future performance. The Credit Suisse Leveraged Loan Index tracks the investable universe of the US-denominated leveraged loan market. Index returns do not reflect any deductions for fees, expenses or taxes. You cannot invest directly in an index. The Credit Suisse Leveraged Loan Index does not represent the performance of any of the Oxford Funds, and the holdings of the Oxford Funds differ (in terms of both constituent investments and allocations among them) from the holdings of the Credit Suisse Leveraged Loan Index.

The CLO structure highlighted above is a hypothetical structure and for illustrative purposes only. CLO vehicles may vary substantially from the hypothetical example set forth above.
U.S. CLOs are financing vehicles where securitization technology is applied to a diversified portfolio of primarily senior secured first lien leveraged loans issued by U.S. companies. The proceeds from the issuance of the CLO debt and equity tranches are used to buy a diversified portfolio of loan assets which are then managed by the CLO manager. Generally, CLOs benefit from structural enhancements and protections including:
| Vintages | # of CLOs | 100% of Par | 90% of Par | 85% of Par | |
|---|---|---|---|---|---|
| Median for 1.0 CLOs | 2003-2008 | 425 | 15.5% | 18.1% | 19.7% |
| Median for 2.0 CLOs | 2010-2013 | 202 | 7.2% | 11.2% | 13.7% |
Source: Wells Fargo Securities, “The U.S. CLO Equity Performance Report”, published on 11/26/2019.
The figures presented in this report do not reflect any projections regarding the returns of any investment strategy and all returns earned on CLO investments will be reduced by any applicable expenses and management fees. Actual performance of a CLO investment will vary and such variance may be material and adverse, including the potential for full loss of principal. CLO investments involve multiple risks, including unhedged credit exposure to companies with speculative-grade ratings, the use of leverage and pricing volatility. While the data and information contained in this report have been obtained from a source that Oxford Funds considers reliable, Oxford Funds has not independently verified all such data and does not represent or warrant that such data and information are accurate or complete, and thus they should not be relied upon as such. IRR calculations have certain inherent limitations as they are calculated based on certain underlying assumptions, which may under or over compensate for the impact, if any, of certain market factors and financial risk, such as lack of liquidity, macroeconomic factors and other similar factors. Assumptions used in the report may not be reflective of actual market conditions in the past, present or future. Past performance is not indicative of, or a guarantee of, future performance.
Despite mark-to-market volatility during the 2008 global financial crisis, historically U.S. CLO rated debt tranches have performed well with low actual realized losses. For example, in 11,237 U.S. CLO debt tranches rated by Moody’s from 1993 to 2018, there have only been 55 tranches impaired from a principal perspective.
| Year | AAA Rated | AA Rated | A Rated | BAA Rated | BA Rated | B Rated | Total |
|---|---|---|---|---|---|---|---|
| 1993–96 | 0 | 0 | 0 | 0 | 0 | 0 | 0 |
| 1997 | 0 | 0 | 0 | 5 | 1 | 0 | 6 |
| 1998 | 0 | 0 | 0 | 12 | 4 | 1 | 17 |
| 1999 | 0 | 0 | 0 | 0 | 5 | 0 | 5 |
| 2000 | 0 | 0 | 0 | 1 | 2 | 0 | 3 |
| 2001 | 0 | 0 | 0 | 2 | 3 | 2 | 7 |
| 2002 | 0 | 0 | 0 | 1 | 3 | 0 | 4 |
| 2003 | 0 | 0 | 0 | 0 | 2 | 0 | 2 |
| 2004 | 0 | 0 | 0 | 0 | 0 | 0 | 0 |
| 2005 | 0 | 0 | 0 | 2 | 0 | 0 | 2 |
| 2006 | 0 | 0 | 1 | 1 | 3 | 1 | 6 |
| 2007 | 0 | 0 | 0 | 0 | 3 | 0 | 3 |
| 2008–18 | 0 | 0 | 0 | 0 | 0 | 0 | 0 |
| Total | 0 | 0 | 1 | 24 | 26 | 4 | 55 |
Source as: Moody’s, “Impairment and Loss Rates of U.S. and European CLOs: 1993 – 2018”, published on 5/17/2019.
| Median for 1.0 CLOs | 2003-2008 | 425 | 15.5% | 18.1% | 19.7% |
|---|---|---|---|---|---|
| Median for 2.0 CLOs | 2010-2013 | 202 | 7.2% | 11.2% | 13.7% |
Source as: Intex, Wells Fargo Securities, “The U.S. CLO Equity Performance Report”, published on 8/12/2019.